
The Houston Stormwater Master Plan (SWMP) initiative is poised to play a pivotal role in providing the City of Houston with a comprehensive stormwater and drainage infrastructure analysis. The information gathered and analyzed through this initiative will serve as a robust foundation for an equitable comparison of flood risk across the City, enabling informed decision-making on drainage projects and studies.
History and Overview
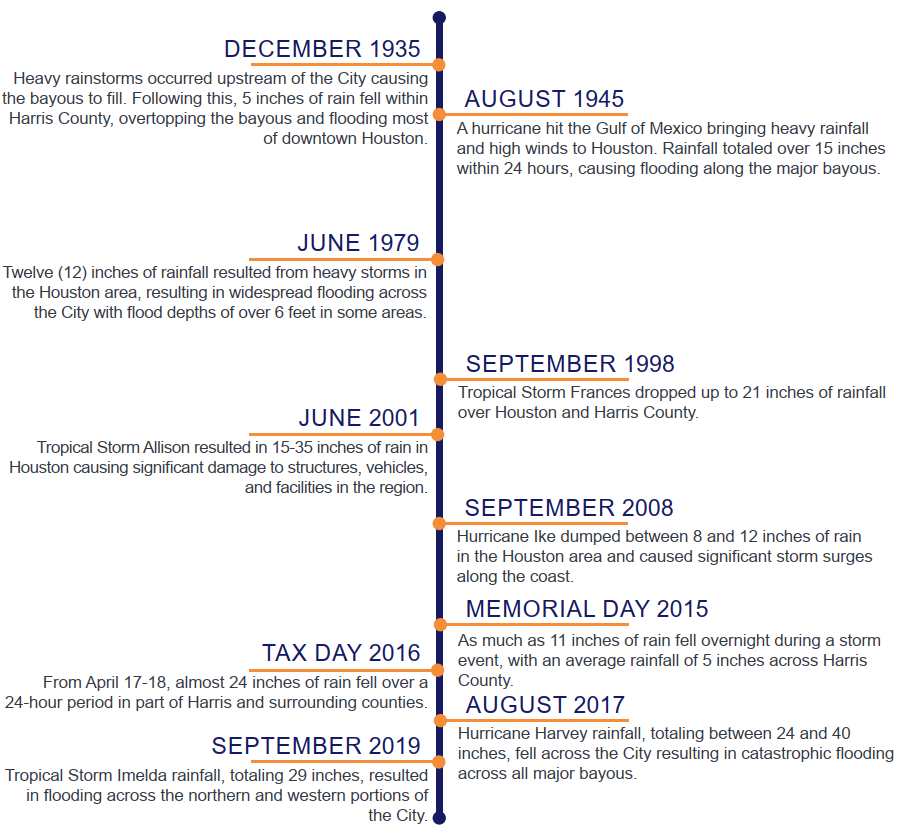
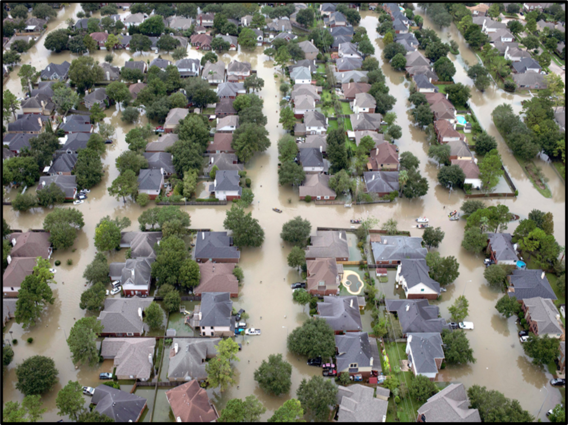
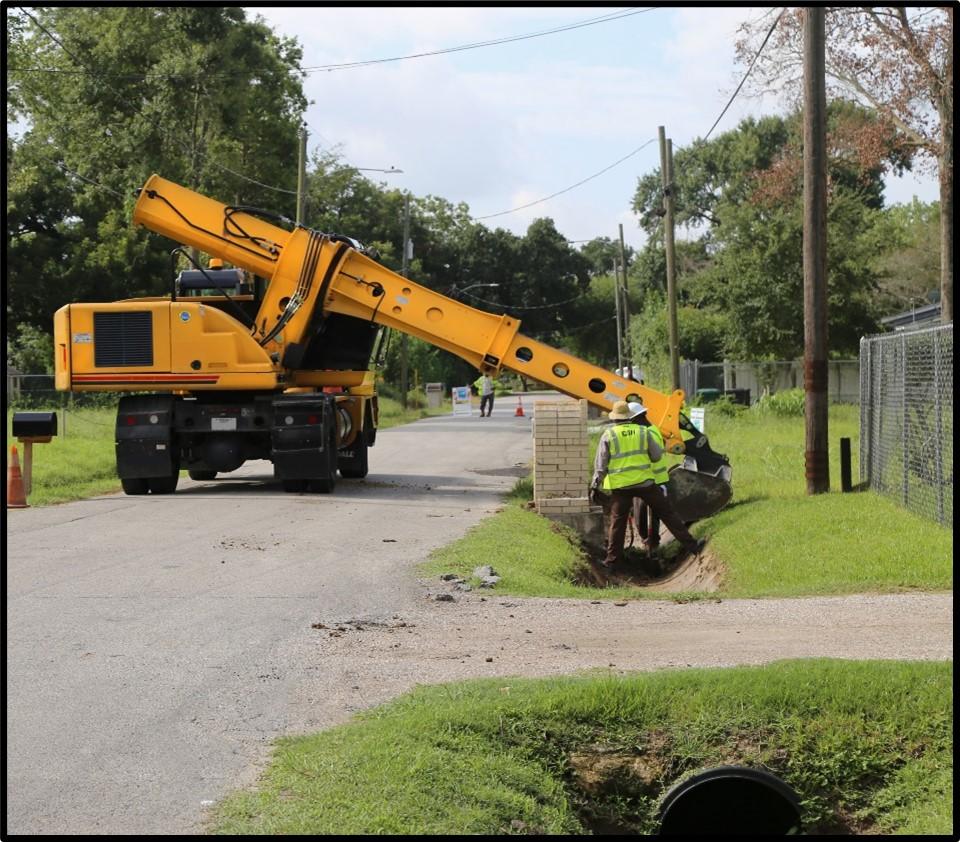
The City of Houston is prone to flooding due to its flat topography, dense development, and proximity to the coast. This flooding causes safety and economic ramifications that impact the Houston region, the state and the nation. Since the 1990s, Houston has completed drainage planning efforts to understand the impacts of flood events better and develop plans and projects to reduce that flood risk for its residents. This study analyzes the influence of the City's local storm sewers and roadside ditches, alongside the drainage patterns caused by the channels, bayous and rivers that convey stormwater to the bay. With this approach, the Houston SWMP initiative provides the first comprehensive look at flooding and drainage patterns in the City.
Previous Planning Efforts
1999
Comprehensive Drainage Plan
* City-wide analysis of storm sewer infrastructure
* Used GIS and rational method
* Determined storm sewer capacity
* Used for CIP identification
2019 - Present
HCFCD MAAPNEXT
* Improving understanding of flood risk in Harris County to allow communities to make more informed decisions
* Developed new models for the bayous and channels throughout the county using the latest information and technology
2010
Rebuild Houston
* Developed drainage impact fee to fund drainage project
* Created prioritization factor to conduct storm drainage planning studies
* Conducted various neighborhood planning studies
2024 - Present
Stormwater Master Plan
* Created a comprehensive, citywide assessment of drainage throughout the City of Houston
* Provides understanding of flood risk based on storm sewers, open ditches, channels, and bayous
* Conducted focus area analysis to identify areas for projects and future studies
2016
Roadside Ditch Drainage Planning
* Updated 1999 CDP to combine storm sewer analysis with open ditches
* Created new outfall boundaries and lidar assessment of drainage infrastructure
* Incorporated into the prioritization framework for a comprehensive analysis
Interactive Map
*Explore the watershed map with detailed planning results and watershed-specific insights
*Storm sewer and roadside ditches
City-Wide Information
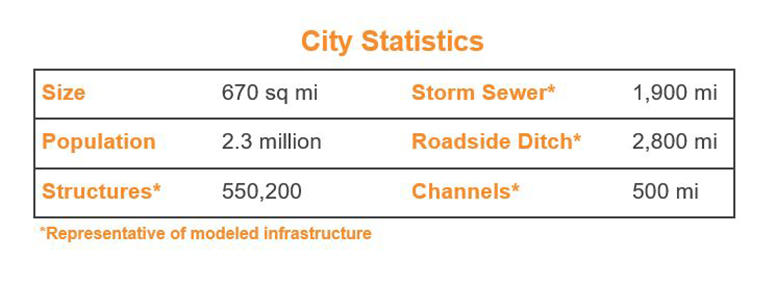
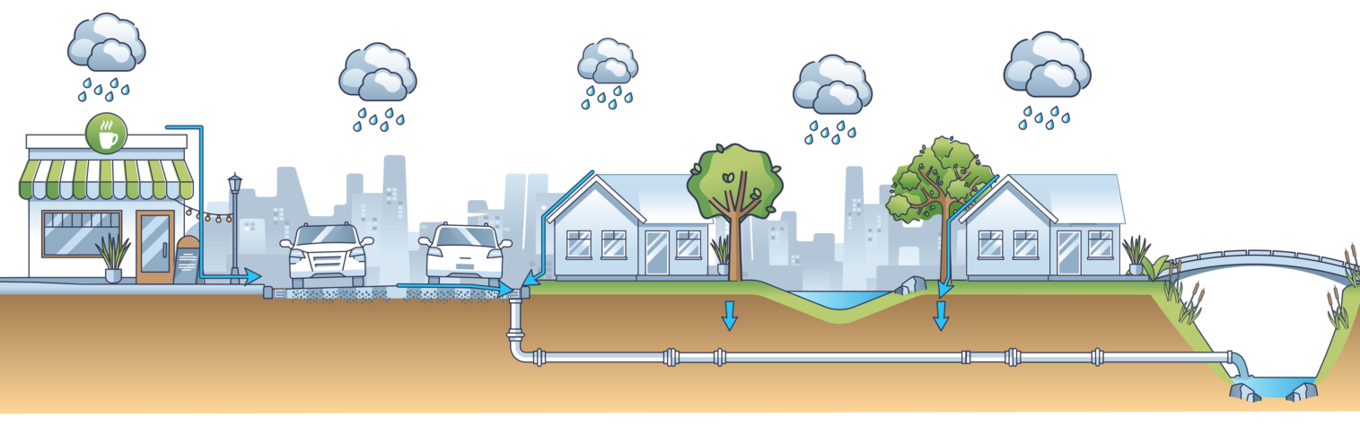
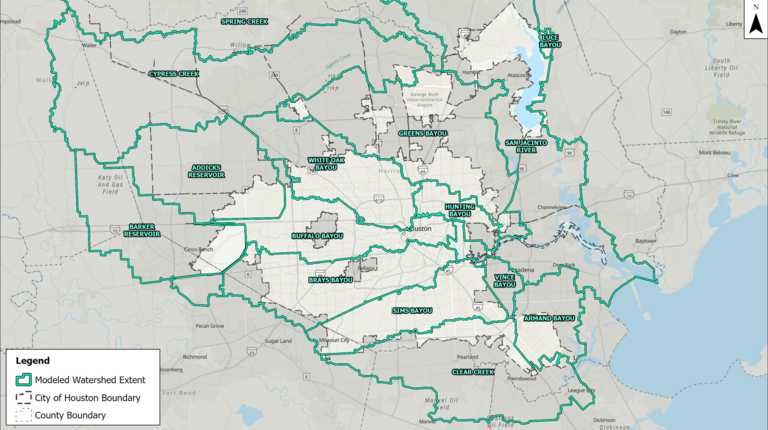
The City of Houston drainage infrastructure consists of two components: primary drainage systems such as the major bayous, rivers, and channels which receive flows from both local runoff as well as contributing watersheds upstream of the City; and secondary drainage systems such as storm sewer and roadside ditch that collect and convey local runoff flows to the primary drainage systems. Both of these types of infrastructure were included within the Houston SWMP.
Results
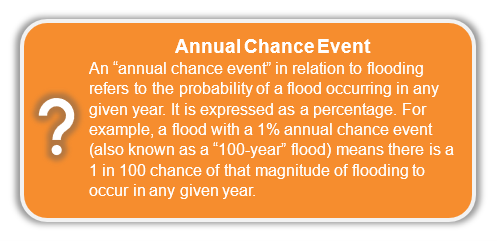
Ponding depths corresponding to seven annual chance events (ACE) were developed for the entire City of Houston. These results were leveraged to analyze existing flood risk throughout the City and identify areas in need of additional study or flood mitigation projects.
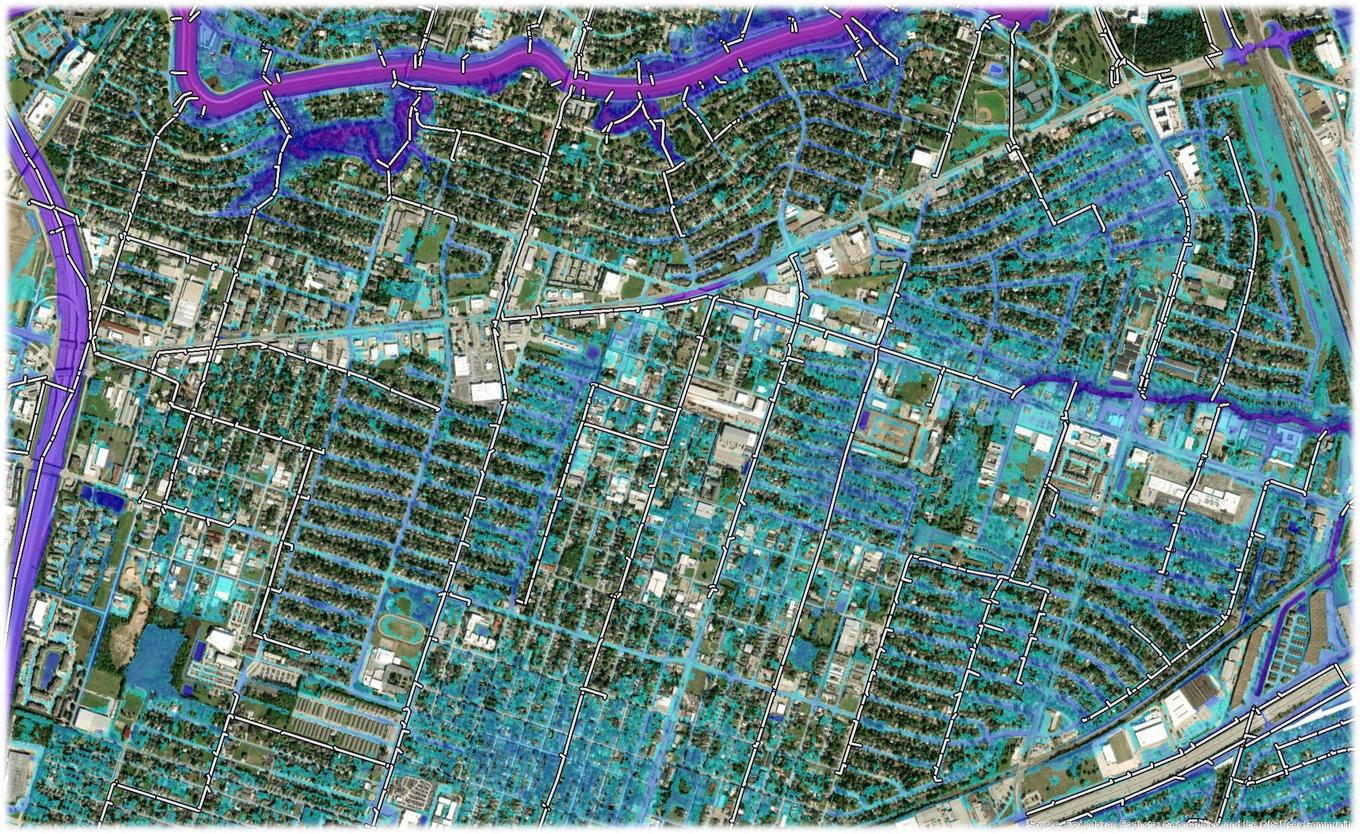
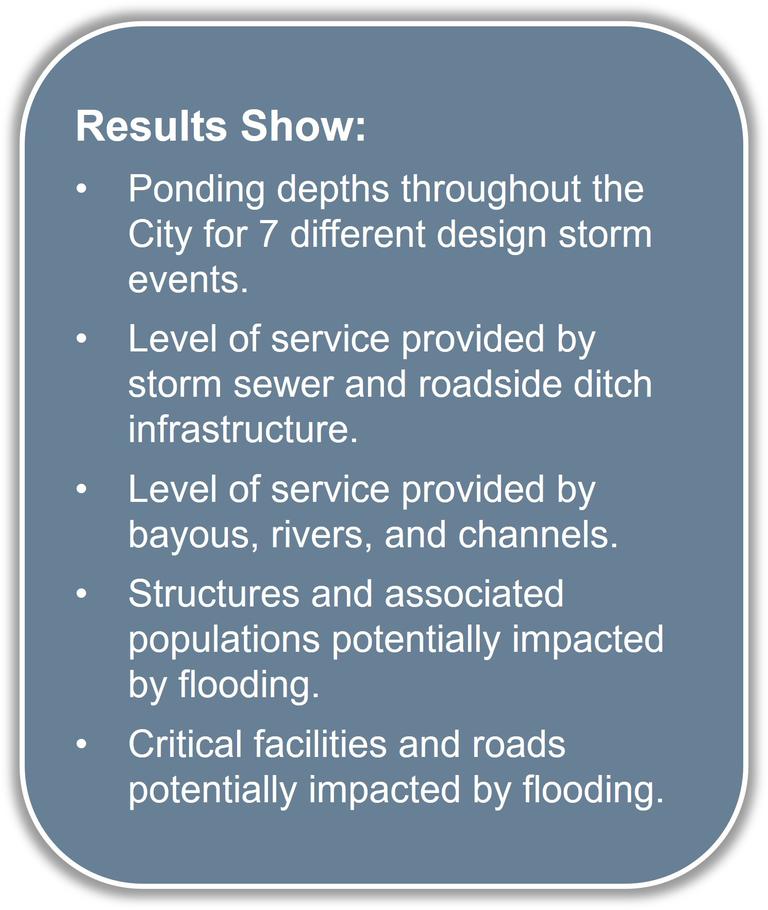
Several frequency storm events were simulated for the City of Houston. Based on the results of the analysis, the performance of drainage infrastructure throughout the City was evaluated. Additionally, structures were evaluated to determine the level of flood risk at each structure.
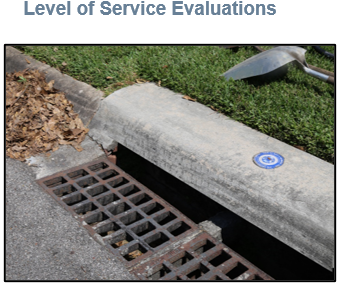
Level of service was evaluated for modeled storm sewer (pipes > 36”). Storm sewer was determined to provide adequate capacity if the flow was contained for the 2-yr event, or within the road right of way for the other modeled events.
Level of service was evaluated for all roadside ditch included in the models. Roadside ditches were determined to provide adequate capacity if peak flows were contained within the banks.
Structures were considered at-risk if modeled flood depths are within 1 ft of the estimated finished floor elevation (FFE). The analyzed structure dataset is sourced from the Texas Water Development Board (TWDB) and includes residential, commercial, industrial, and agricultural buildings.
At-risk population was determined based on the associated population estimated to be within each at-risk structure. Populations per structure were based on the TWDB dataset and refined where they were determined to be inaccurate.
City Watershed Map
Click on one of the watershed plan links to open a webpage with detailed planning results and watershed specific insights.
Focus Area Technical Overview
The results produced by the Houston SWMP provide a comprehensive overview of existing flood risk throughout the City of Houston. However, identifying the “most severe” flood risk areas can be overwhelming and highly subjective. Many different factors can and should be considered when prioritizing the needs for detailed studies and drainage project implementation. To help accumulate the results of this study into concise flood risk information, a Focus Area Evaluation was performed.
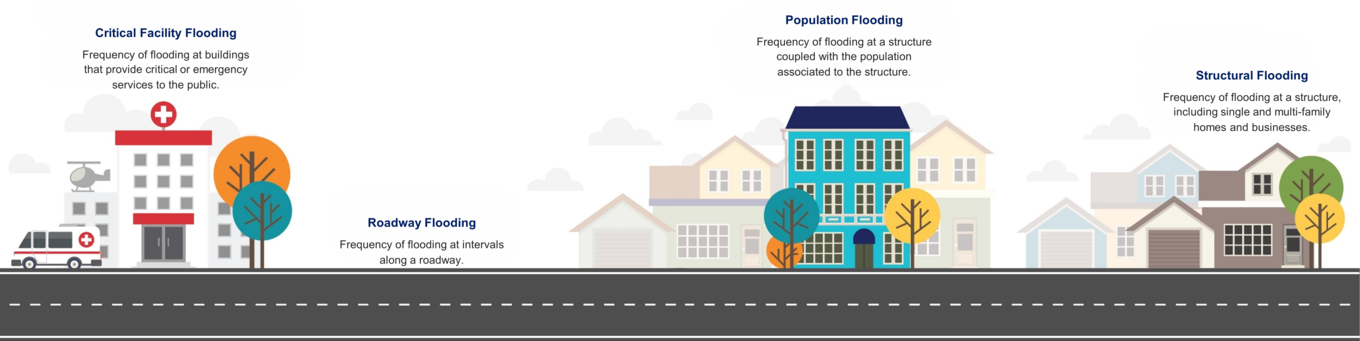
Modeling results, including depth and water surface elevations from each modeled event, were used to perform the Focus Area Evaluation. Flood risk related to structures, population, road, and critical facilities can be considered within the evaluation.
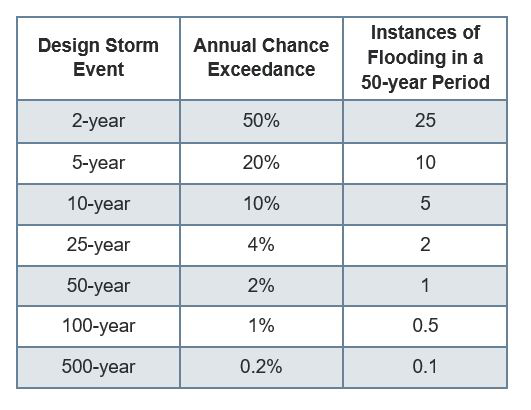
Instance of Flooding
To adequately define flooding within the City, a new measurement was created – “Instance of Flooding”.

This metric helps define how often flooding will occur for a specific point within the City. As an example, a structure that is flooded in a 2-year design event has the statistical probability of flooding 25 times in a 50-year period. Whereas a structure that floods in the 50-year design event only has the statistical probability of flooding once in a 50-year period.
Instances of flooding does not consider the depth of flooding in any given event, instead only looking at if a given site does or does not flood.
Flood Risk Index
Instances of flooding can be determined for any site within the City, be it a structure, populations, critical facility, or roadway. These instances can then be weighted to prioritize flood risk at specific component types. When added together, the flood risk for an area can be characterized in a single value – the Flood Risk Index.

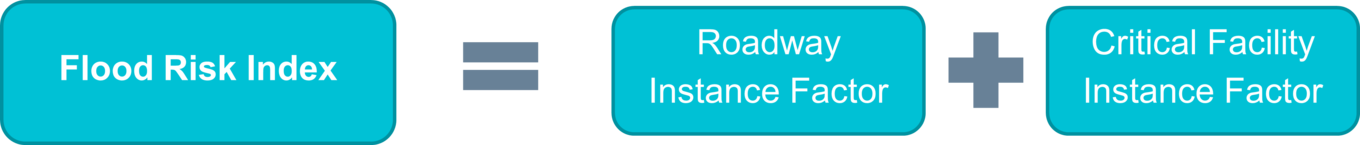
Flood Risk Indexes range between values of 1 and 5. A higher value is associated with higher potential for flood risk when compared to other areas. A lower value is associated with lower potential for flood risk when compared to other areas.
Analysis
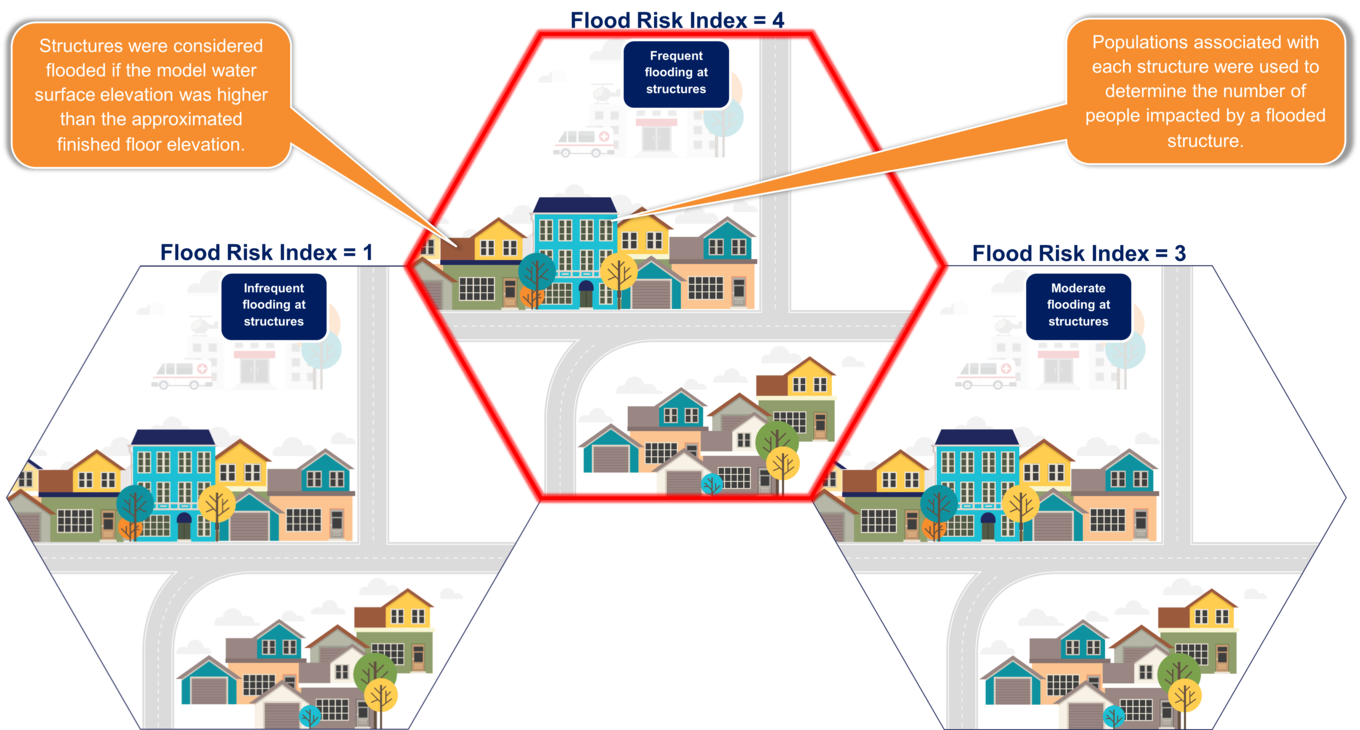
Structures & Population Sample Analysis
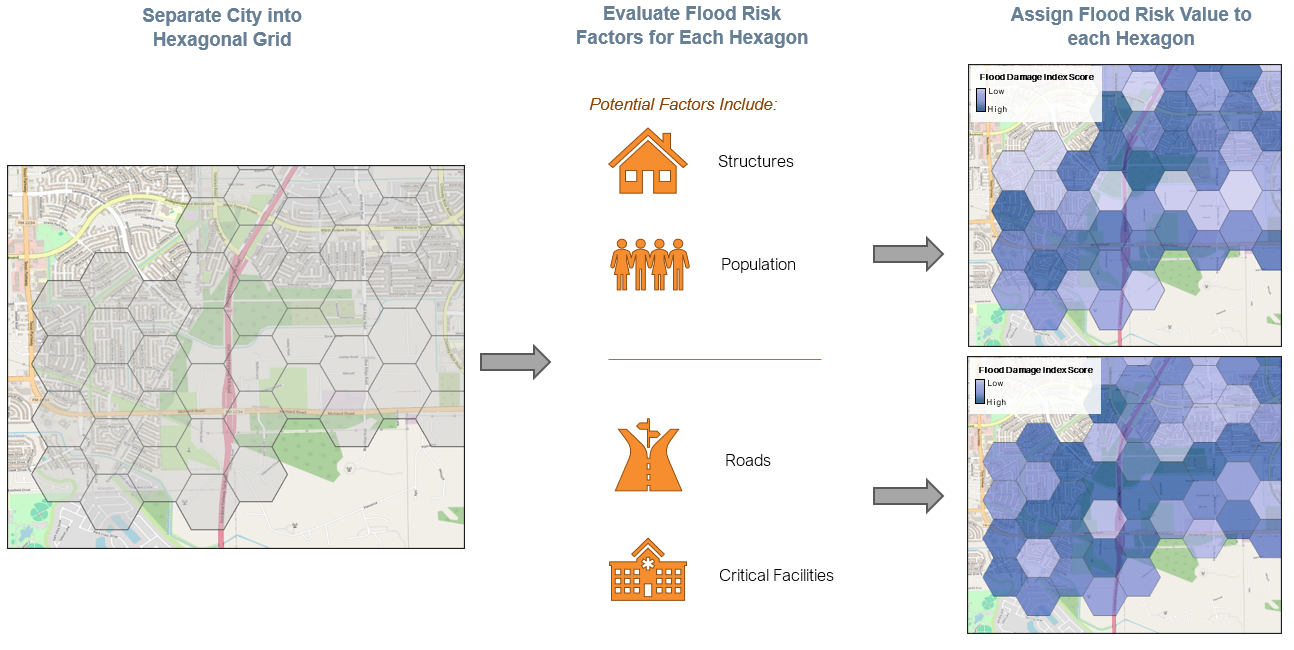
The City of Houston was analyzed using a hexagonal grid to group the flood risk assessment. A Flood Risk Index was calculated for each hexagon within the City based on the infrastructure within the area, and the modeling results. The example below shows three hexagons with FRI values ranging from 1 to 5 based on the severity of structural flooding and population flooding of the infrastructure in the identified hexagonal areas.
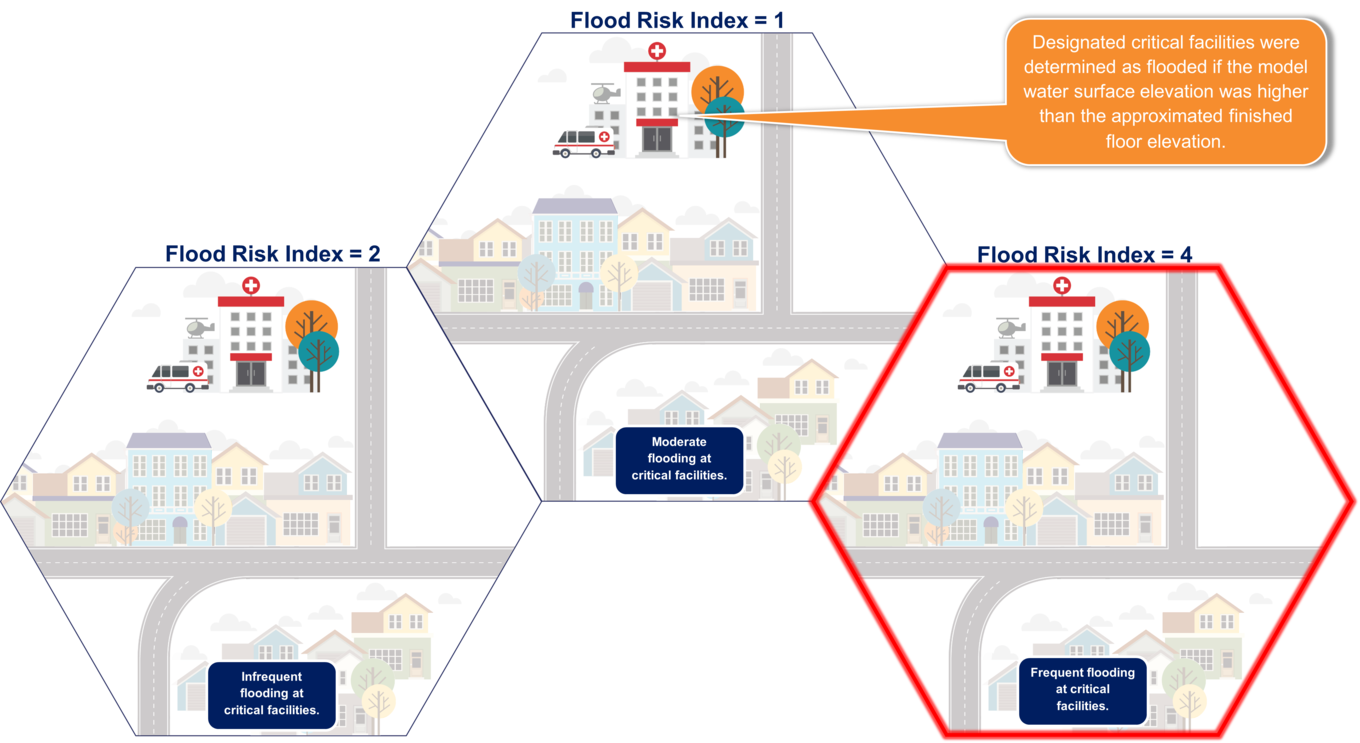
Critical Facilities Sample Analysis
The example below shows three hexagons with Flood Risk Index values ranging from 1 to 5 based on the severity of critical facility flooding of the infrastructure within the identified hexagonal area. Note that the scores for critical facility flooding differ from the scores for structure and population flooding because the flood risk associated with a critical facility may differ from the flood risk associated with structures and populations within the same hexagon.
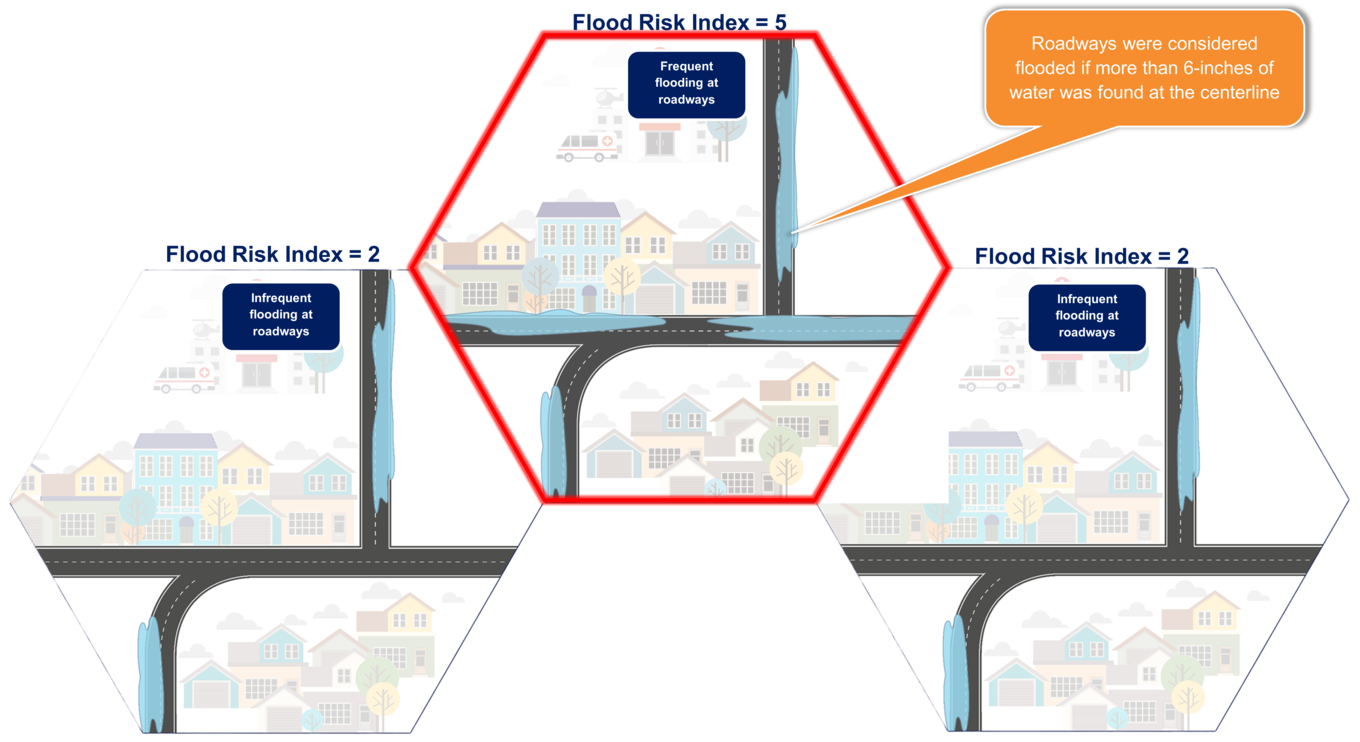
Roadway Sample Analysis
The example below shows three hexagons with Flood Risk Index values ranging from 1 to 5 based on the severity of roadway flooding for the roads within the identified hexagonal area. Note that the scores for roadway flooding differ from the scores for critical facilities, structures, and population flooding because the flood risk associated with a roadway may differ from the flood risk associated with the other instance factors within the same hexagon.
Grouping
Hexagons are developed across the city. Flood risk metrics are evaluated per hexagon to develop a Flood Risk Index Score. Scores are compared to determine severity of risk across City and identify areas of highest flood risk.
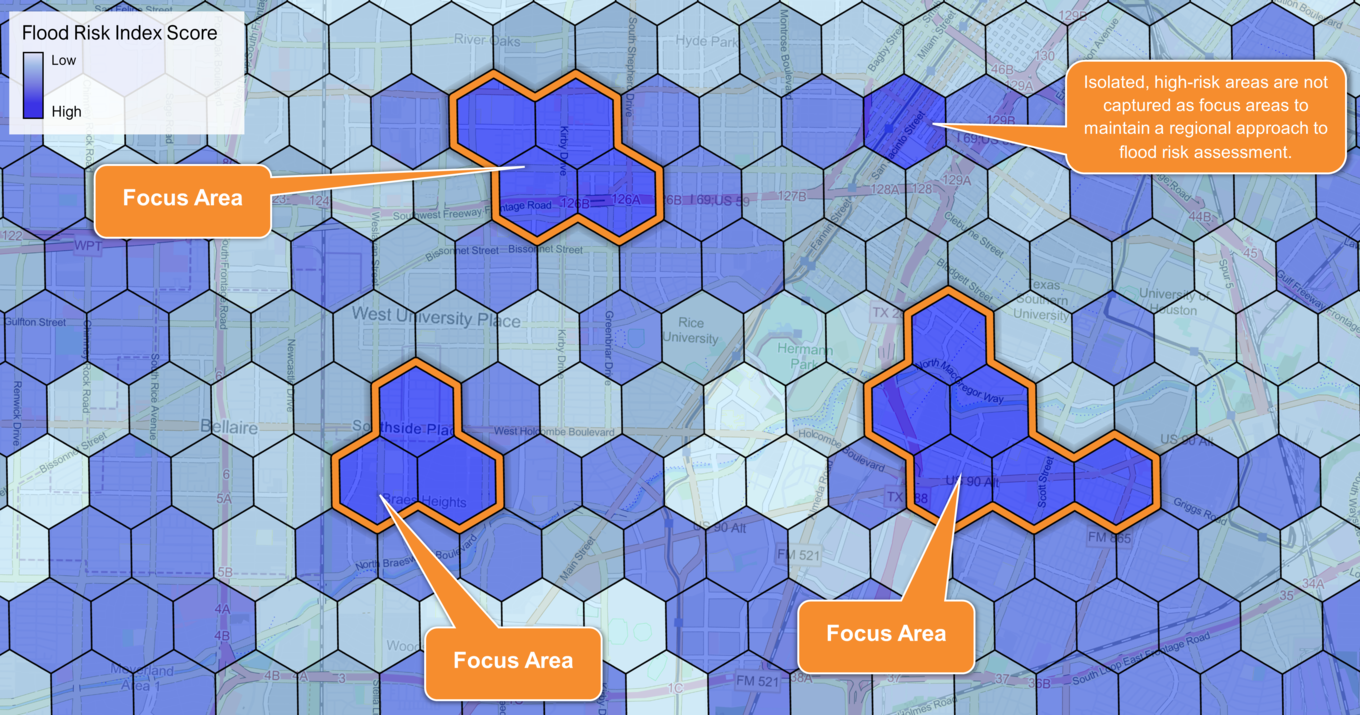
Adjacent areas with high flood risk were grouped together to identify Focus Areas for future studies and projects. Different thresholds can be used to identify appropriately sized Focus Areas, or different levels of risk. The example below shows groupings of 3 or more hexagons with Flood Risk Index scores higher than 4.5.
Implementation
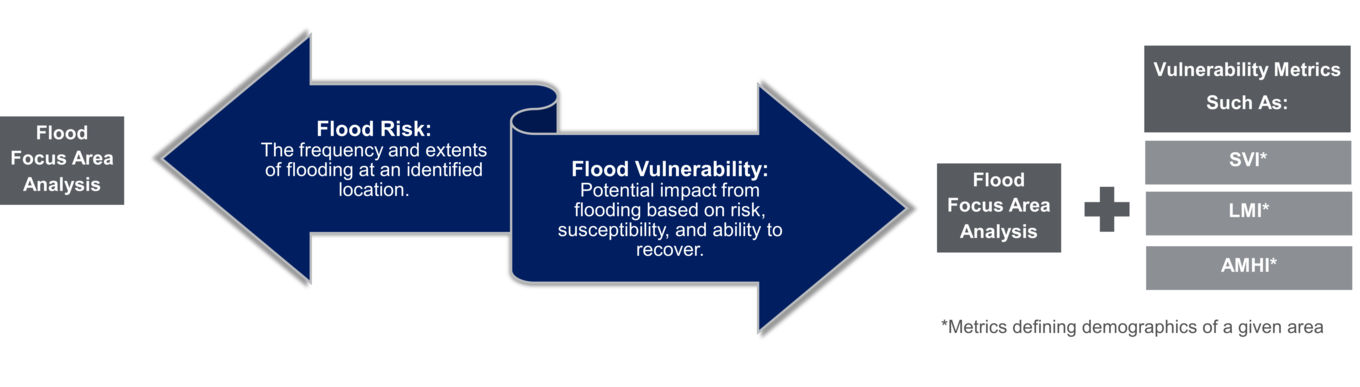
The Focus Area evaluation is a useful methodology to summarize extensive flood risk data into concise, comparable, and actionable information.

In many cases, information beyond pure flood risk assessment is needed to prioritize projects, pursue funding opportunities, and understand the impact that flood risk mitigation measures would have on people’s lives. Much of the information used for these further assessments helps define flood vulnerability in addition to flood risk. The Focus Area Evaluation can be paired with this vulnerability data to filter through Focus Areas and determine which ones meet current City needs and goals.